By *Sharma London
I recently came into possession of 10 years’ worth of records — a listing of names, dates, ages, etc. of Vincentians who have died between 2010 and 2019, inclusive.
My goal here is to discuss the findings, with the hopes that you would be left with questions. I had questions too while doing this analysis; some of which I posed to others privately. I received mixed reactions. Some thought it was normal; others were alarmed.
I am going to try to not be too technical with this presentation, but unfortunately we need to use some charts to help us see the picture. I’m going to also try to not inject my personal opinion. The goal here is just to ask if you find this alarming.
For those years mentioned (2010-2019), the records indicate a total of 9,238 total deaths. That’s an average of 923 per year. It has long been presented that the total population hovers around 110,000, with a current (as of the end of June 2020) voting population of about to 96,650. Some have argued that this list of voters is bloated; and if one were to consider the total population size, it’s a fair grudge to suggest that is unlikely that 87% of the population is of voting age.
Nonetheless, I state that for context as we move forward with this discussion. If we take the numbers as they are, 9,238 deaths is a reflection of about 10% of the voting population and about 8% of the total population.
Let’s look at the yearly trending for those years.
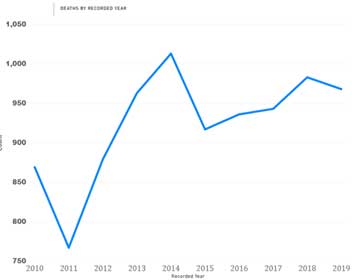
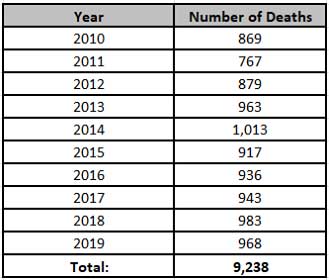
The first question I asked after seeing this visual is what happened between 2011 and 2014? There’s a low point in 2011, followed by a steady climb into 2014.
Since 2014 presented the highest point with 1,013, let’s look closer at the months in 2014.
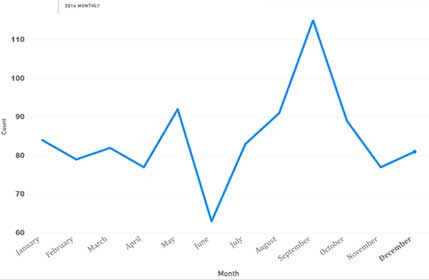
Here you see September with the highest peak in 2014, with 115. Essentially, the numbers were highest in the 3rd quarter of 2014. In an attempt to not bore you with too many of these charts, I will just speak to the days in September rather than showing a model. There were several days in that month with six and seven recorded deaths on each of those days. For example, on the 24th, there were seven recorded deaths. On the 12th and the 19th, there were six each.
To close out this discussion, we look at 2011 (shown below), which recorded the least number (767) in that 10-year span.
Notice that it starts off high before declining towards to the middle of year, then climbing again. The middle of the year had less activity than the beginning and closer to the end; essentially the first and third quarters were highest.
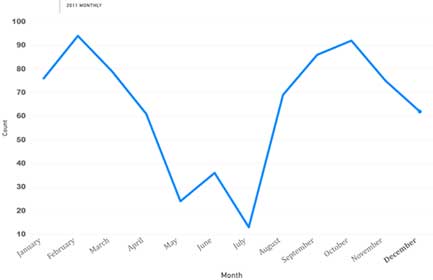
Once again, in an attempt to not bore you with too many of these charts, I will only speak to February’s total of 94. The 5th and the 17th of February recorded a total seven each on those days, so even though 2011 overall recorded the least number of deaths, there are still some days where in some cases the daily number was just as high as some of the other years with a higher total. Oct. 1, 2011 also recorded a total seven on that day.
For this purpose, it is not necessary to review all of the years in detail, but I will just highlight 2018, which had the second highest total, after 2014. March of 2018 recorded a total of 107; with eight deaths on the 8th, and 7 on the 30th.
Last, I took a chance at mapping each record to a constituency, since it may be more relatable to some. You would notice an “N/A” category. As you may know and realise that often when a person dies, there is no record of that person’s address. For this exercise, such records were classified as “N/A”, so that the total of 9,238 can be reflected.
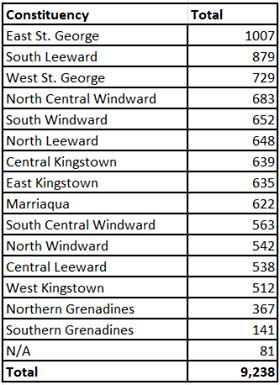
Revisiting the question that I posed: is this normal? Do you find it alarming? In February of this year, one local news media carried a story headlined: “Sixty-two amputations in 2019”. It may not mean anything for our discussion here, but is it suggesting that there is “smoke” to a bigger “fire”?
*Sharma London is a software engineer with background and academic credentials in applied mathematics, computer science, and information technology; inclusive of data management and analysis.
The opinions presented in this content belong to the author and may not necessarily reflect the perspectives or editorial stance of iWitness News. Opinion pieces can be submitted to [email protected].


We need to know what percentage died at home. Hospital. Road fatalities. Age. Sex. Homicide. Domestic violence. Drowning.. Other causes of death. Suicide…
Need stats.
Very interested article and alarming, however, I’ve come to realized that some Vincentains rather party over health and until they rise above this grass root mentally nothing will change, not for their health or pocket book, they will forever be scraping the bottom of the barrel and depending on love ones abroad to help them out. Since I was a kid, all I’m hearing is that the population is a 110. Base on the numbers provided of deaths per year, is the number of deaths the same as the number of births, because this is the only way the population can steadily remain at 110.
Another thing, if 87% of the population is at a voting age, that means 87% of the population is over 18yrs something just isn’t adding up. the only way a population can steadily remain the same is if the total deaths and birth rate is around the same yearly. This is just my take on this.
Knowing the cause of death and linking it to the various constituencies might lend for better discussions. The rates for various age groups might also be helpful. The raw numbers as presented doesn’t allow me to decide whether they are alarming or not.
Most amputations in SVG are to do with Diabetus infections of the feet. We were told those amputations would stop with the introduction of the Cuban medication Heberprot-P.
Peter Binose wrote a number of articles on the subject, see
https://www.iwnsvg.com/2013/09/22/svg-amputation-capital-of-the-caribbean/
About six years later in 2018 Minister of Health Luke Browne said that the introduction of Heberprot has caused a dramatic reduction in the number of amputations in SVG.
He said there were 72 amputations in 2015 before the drug was introduced. He went on to say after the introduction of the drug in 2016, the number of amputations for the year fell to only 19. This represents great progress for healthcare in St Vincent and the Grenadines.
Brown went on to blow the bugle for SVGs healt care sayining “the government is firmly focussed and committed to the task of improving health and well being in the country in every aspect.”
https://news784.com/local-news/amputations-have-fallen-drastically-in-st-vincent/
Now I do not know if Luke was telling lies or not, but it would be interesting to know if the amputations you refer to are due to diabetic ulcers and if we are still using the Cuban product, if we are has it stopped working, or did it ever work?
In 2017 a Specialist diabetic team of American of doctors and nurses came from Brooklyn to SVG having heard the SVG is still the amputation capital of the Caribbean.
Reading between the lines they decided our people just did not know what they were doing and that we need help.
https://www.caribbeanlifenews.com/brooklyn-based-medical-team-helps-vincentians/
If people are dying of amputations what is the total that is still being done annually in SVG?
Are we back as the Guiness Book of Records nominees for the Caribbeans amputation capital?
In God we trust, the rest appear to be mandacious monsters.
By the way the death rate in developed countries is about 850 deaths per 100,000 population. So we are not far off the norm seeing as we are a backward third world country under the ULP. About a 1000 a year would be about what we can expect.
But it is the amputations, that is what intetrests me most. Because according to Cess Makay and Luke Browne the Cuban Hepperprot – P said it would all but eliminate the flying feet syndrome.
In the United States, every 17 seconds someone is diagnosed with diabetes, and everyday 230 Americans with diabetes will suffer an amputation,” Fakorede wrote. “Throughout the world, it is estimated that every 30 seconds a leg is amputated. And 85% of these amputations were the result of a diabetic foot ulcer.”
Mortality following amputation ranges from 13 to 40% in 1 year, 35–65% in 3 years, and 39–80% in 5 years, being worse than most malignancies.
Why if Hepoprot-P is such a wonderful product have the world figures increased for lower limb amputations, is it not the wonder drug we were led to believe it was? It has after all been about for almost 20 years.
Nice to see this information coming forth. These are things we should know. As a health worker this is the first time I am seeing this information presented. Sadly whenever a healthy discussion is made about the pitfalls in our country, they only thing some vincentians can see is politics. If we can’t discuss what is killing us, how can we improve our life expectancy or screen effectively when vital information is kept secret.
Very informative and instructive indeed. Thanks. It might be of great national interest to do a similar exercise, say for the years 1993-2000
I honestly don’t see the point of this article. What about the portion of the population that reach the voting age every year? I get that the author is trying to ask a question but be thorough and do more meaningful research and present a full spectrum of data. If you can present information about the number of persons who register for ID cards for the first time or estimated migration numbers and maybe compare those numbers with that of the deaths. It may not be anywhere accurate but at least it would serve as a basis to start a discussion. Not bashing the author…but wheel and come again.
Love this data presentation. I wish the authorities see the importance of data and start capturing as much information as possible. How many were attributed to non – communicable diseases including cancers, diabetes, hypertension,kidneydisease and heart diseases. Are these diseases geographically correlated? This way targeted interventions can be made
This information could be useful in a broader study, but on it’s own, it’s incomplete.
Is it normal to have 900 deaths per year? From the figures it is. Are there comparative analysis of other countries?
Monty why do you not research it yourself and bring it here to the people. Its available for every country, so instead of asking the question look and tell us your findings.
A comparison with a similar period by age group under the NDP administration would make an interesting comparison. Will look forward to another submission using the same. Also include cause of death as indicated by other writers.
Mr providence considering the smallness of our island and population it is alarmingly high based on this data! That reminds me, I always wondered after 38 years of existence, why our population was always at 110,000? And our national census seems disorganized….the last census done was burnt…..and none was conducted after that……so yes these, numbers are rational cause to sound the alarm once this data is accurate.
Thanks to Sharma London for presenting important statistics on our situation here in SVG. It would be good to know (1) how does the data from a similar length of time matches up and (2) at the end of 2020 how do those numbers compare for 2020, so we can get some way to evaluate if we are having an issue with the coronavirus.
I would not be surprised to find out that these numbers are quite high and I am glad that a few of those commenting pointed a finger at diabetes and amputations. We do have a problem with diabetes and last year I took the opportunity to talk to a few treating physicians and nurses and I must say that I was alarmed that they are not evolving with new information.
People with diabetes are people with a nutrition/life style problem, but the treatment in SVG (and many other places)is NOT nutrition/life style adjustment. It is chemical. Without getting too wordy may I suggest if your doctor tells you that your diabetes is so bad, that you need to have your foot amputated BEFORE he/she introduced you to a FASTING regimen then you are not getting good advice.
Google Dr. Jason Fung on Intermittent FASTING and diabetes and approach your diabetes (type 2), obesity, high blood pressure from an entirely different angle. NO cost.
Mr Providence, considering the smallness of our island and population the deaths per year are alarmingly high based on what this data has revealed. That reminds me, I always wondered after 38 years of existence, why our population remains at 110,000? And our national census seems disorganized….the last census that was done, was burnt…and none was conducted after that. So yes, these numbers are rational cause to sound the alarm, once this data is accurate.
Ppl understand no stone maker come on this earth
I look at data everyday in PowerBI. Data is malleable and can say anything. There need to be a baseline, a context and a goal, this data lacks all three This amounts to throwing some blocks unto a foundation and asking observers to critique the building.
Hopefully such inquiries can nudge us to the path were we unearth solutions to create a viable SVG. Here’s another alarming development that received no attention over the years: In 1980 SVG had a population of 100,000. Grenada stood at 90,000; St Lucia, 118,000. Today however, Grenada has surpassed us with just over 110,000 and St Lucia with its exponential expansion, stands at 180,000 plus. The 10,000 difference in favor of SVG 1980, has been erased by the “Spice Iles.” St Lucia on the other hand will double our population in a few years. So if we use 1980 as a focal point, and examine the decades thereafter, there are some serious issues with SVG population growth rate that needs addressing.
Dasheen is the culprit. Dieting should be able to reduce the problem. Sugar is the culprit and folks should reduce their sugar intake. I have seen the effect when I drink lots of juices. Those lands close to Montreal Gardens should be used to produce vegetables. I saw tons of dasheen coming from that area.
I am not sure if those commenting here are part of the death rate. Because I tell you its about normal and you all carry on making silly comments.
According to the US CDC the Death rate: 863.8 deaths per 100,000 population. Every question you ask if you ask your search engines the same question you will get the answer many times over.
The ignorance is astounding.